
Pricing the Plate
A Buyer's Guide to Grilling Season 2026
HighLine Consulting Group Inc | Special Report
Spring 2026 | HighLine Protein Market Insights
Confidential | For Subscriber Use Only
Editor's Note
Every year, the stretch from Memorial Day through Labor Day represents the most emotionally and commercially significant protein purchasing period in America. Grills go on, families gather, and buyers face the same question they always face: am I positioned well, or am I about to get surprised by the market?
This report is designed to take the guesswork out of it. What follows is a data-driven, straight-talking procurement intelligence guide to grilling season 2026. We cover current pricing, historical holiday patterns, weather signals, and the supply fundamentals that will determine how this summer unfolds.
This is not a celebration of summer. It is a briefing for protein buyers who want to go into the season with their eyes open.
Michael DiSabato | Founder, HighLine Consulting Group Inc
Executive Summary

Figure ES-1. Visual Executive Summary, Spring 2026 Special Report.
The visual summary above captures the cross-protein procurement landscape entering the 2026 grilling season at a glance. The detailed analysis, pricing data, and procurement playbook follow in Sections 1 through 5.
Contents
- The Cuts That Matter: Pricing Trends for Key Grilling Cuts
- The Holiday Pricing Calendar: 5-Year Historical Pricing
- Weather Outlook: Summer 2026 Climate Forecast (Continental US)
- Supply Fundamentals: From Feedlot to Fork
- The Procurement Playbook: What Buyers Should Do Before Memorial Day
- Appendix: Methodology and Data Sources
Section 1: The Cuts That Matter
Pricing Trends for Key Grilling Cuts, Spring 2026
Grilling season procurement lives or dies on a handful of cuts. This section covers current market pricing for the primals and subprimals that drive the most volume from Memorial Day through Labor Day. The goal is to give buyers a clear read on where prices stand today, how they compare to last year, and where pressure is building.
Pricing reference week: April 20-24, 2026 (April 13-20 for chicken). All prices are weighted-average $/lb sourced directly from USDA AMS reports LM_XB459, LM_XB460 (National basis), LM_PK610, and AMS_3646. The 2026 YTD column shows the weekly weighted-average trajectory year-to-date as a sparkline.
1.1 Beef Grilling Cuts
| Description | Current Price ($/lb) | W/W Change | Y/Y Change |
|---|---|---|---|
| Ribeye (112A boneless, heavy) | $11.26 | +3.2% | (13.3)% |
| Striploin (180 boneless, 0x1) | $10.60 | +0.2% | (1.1)% |
| Top Butt (184 boneless) | $6.18 | +2.9% | +0.8% |
| Tenderloin (189A trimmed, heavy) | $15.31 | +0.5% | +10.8% |
Pricing commentary. The beef complex tells two stories. Tenderloin and trim are running aggressively higher year-over-year. Tenderloin is up 10.8%, fresh 90% trim is up 20.1%, and fresh 50% trim is up 71.9% off a depressed 2025 base. Top butt is up modestly at +0.8%, while striploin (-1.1%) and ribeye (-13.3%) are showing year-over-year declines off elevated April 2025 reference points. The 2026 YTD trajectory is what matters: ribeye has rebuilt sharply from a January low of $9.81 to current $11.26, striploin from $8.12 to $10.60, and tenderloin held in a tight $14.00-$15.90 range all year. The structural story remains intact: April 1 cattle on feed at 11.6 million head is down 1% year-over-year for the seventeenth consecutive month, year-to-date slaughter is running 9.9% behind 2025, and packers are feeding to heavier weights to compensate without success on a pounds-of-beef basis. Trim has the cleanest read: tight slaughter cow numbers and surging burger demand are driving fresh 90% to record territory and fresh 50% off a 2024 collapse.
1.1b Beef Trim
| Description | Current Price ($/lb) | W/W Change | Y/Y Change |
|---|---|---|---|
| Fresh 90% Beef Trim | $4.50 | (0.2)% | +20.1% |
| Fresh 50% Beef Trim | $1.92 | +4.5% | +71.9% |
1.2 Pork Grilling Cuts
| Description | Current Price ($/lb) | W/W Change | Y/Y Change |
|---|---|---|---|
| Boneless Center-Cut Loin (Strap-on) | $1.34 | +4.1% | +0.3% |
| Backribs (2.0 lb/up) | $2.91 | +2.7% | (0.5)% |
| Trimmed Spareribs, Light | $1.85 | +3.8% | +13.6% |
| St. Louis Spareribs (VAC) | $2.45 | +4.3% | +9.1% |
| BBQ Style Spareribs (VAC) | $2.21 | +2.1% | +11.9% |
| Pork Tenderloin | $1.83 | +0.3% | +5.8% |
Pricing commentary. Pork is firmer than the headline cutout suggests. The rib complex is the standout story. Trimmed light spareribs are up 13.6% year-over-year, BBQ style is up 11.9%, and St. Louis is up 9.1%, all firming through April with strong week-over-week moves as packers and processors pull product for the Memorial Day window. The split between rib styles matters: St. Louis at $2.45/lb continues to command a 33% premium over trimmed light at $1.85/lb, reflecting differentiated foodservice demand. Backribs at $2.91/lb sit nearly flat year-over-year, signaling adequate availability against steady QSR pull. Loin and tenderloin are flat year-over-year at $1.34/lb and $1.83/lb respectively, providing the value anchors that pork procurement always offers in May. The breeding herd at 5.89 million head is the smallest March 1 reading since 2014 and signals tightening into Q4 2026.
1.3 Chicken Grilling Cuts
| Description | Current Price ($/lb) | W/W Change | Y/Y Change |
|---|---|---|---|
| Boneless Skinless Breast | $1.68 | (2.7)% | (39.0)% |
| Tenders | $1.83 | (1.1)% | (18.6)% |
| Boneless Skinless Thighs | $1.87 | +1.2% | (18.8)% |
| Bone-In Thighs | $0.75 | +1.3% | (14.8)% |
Note: Chicken pricing reference week is April 13-20, 2026. AMS_3646 reports values in cents per pound; figures here are converted to $/lb.
Pricing commentary. The chicken market is the inverse of beef. Every cut is meaningfully below year-ago, with breast meat down a striking 39%. The reason is simple: April 2025 was the late-cycle peak for an overheated chicken market, with breast wholesale at $2.76/lb. By October 2025 breast had collapsed to $1.13/lb on aggressive supply growth and softer foodservice demand. The market has been rebuilding since the start of 2026, with breast climbing from a January low of $1.19/lb to current $1.68/lb, but it sits well below the 2024 and 2025 reference points. Tenders, boneless thighs, and bone-in thighs all show the same pattern: down 15-19% year-over-year against a still-elevated 2025 base, with steady week-over-week support through Q1 2026. Broiler placements at 198 million chicks for the week ending April 18 are up 4% year-over-year, but pullet placements are running 4% below year-ago, reflecting the cumulative HPAI impact on broiler breeder flocks.
PROCUREMENT SIGNAL | The cross-protein spread has rebuilt in chicken's favor. Boneless skinless breast at $1.68/lb sits $9.58/lb below Choice ribeye at $11.26/lb, the widest absolute gap in our dataset. Pork ribs are firming hard into Memorial Day and offer the only truly seasonal pricing pressure on the menu. Beef trim, especially fresh 50% lean, is the cost shock to model into back-half formulation. Buyers who can flex menu mix toward chicken now, lock pork rib coverage before May 10, and forward-contract beef middle meats for the late-summer window will out-execute their peers this season.
Section 2: The Holiday Pricing Calendar
5-Year Historical Pricing: Memorial Day, July 4th and Labor Day
Grilling season is not one event. It is three. Memorial Day, Independence Day, and Labor Day each produce distinct demand spikes and pricing responses. Understanding those patterns over time is the single most valuable thing a protein buyer can do before placing their seasonal orders.
This section presents five years of holiday-window pricing data for every cut identified in Section 1. Methodology: holiday window is defined as the two AMS reporting weeks preceding the holiday plus the AMS reporting week containing or immediately following the holiday (three weeks total). Prices are weighted-average $/lb across the window. All figures are direct reads from USDA AMS source reports.
METHODOLOGY NOTE | This section uses the longest clean USDA AMS history available for each protein. Beef and pork charts cover the full five-year window (2021-2025), drawn from the mature LM_XB459, LM_XB460, and LM_PK610 series. Chicken charts cover available history only: 2023-2025 for the Memorial Day and July 4 windows, and 2022-2025 for the Labor Day window. The AMS_3646 weekly chicken series begins in August 2022, which is why earlier chicken holiday windows do not appear. Reducing beef and pork to a three-year window for cosmetic symmetry would discard the post-pandemic dislocation reference points (2021 peak) and the cyclical low (2022) that anchor the rebuild narrative throughout the report. Each commodity is shown using the best data it has.
2.1 Memorial Day Pricing Patterns
Holiday dates: 5/31/21, 5/30/22, 5/29/23, 5/27/24, 5/26/25

Figure 1. Beef Middle Meats: Memorial Day Pricing, 2021-2025.

Figure 2. Beef Trim: Memorial Day Pricing, 2021-2025.

Figure 3. Pork Cuts: Memorial Day Pricing, 2021-2025.

Figure 4. Chicken Cuts: Memorial Day Pricing, 2023-2025.
Analysis. The 2021 Memorial Day window is the recent-history reference for record Choice beef pricing, with ribeye at $13.05/lb and tenderloin at $17.50/lb amid post-pandemic supply chain dislocation. 2022 marked the cyclical low for premium cuts as packer margins compressed and demand normalized. The 2023-to-2025 trajectory shows the steady rebuild as cattle inventories tightened: ribeye climbed from $9.25 to $12.89/lb, striploin from $8.35 to $11.11/lb. Top butt set its 5-year high at $6.55/lb in 2025. Pork shows the opposite pattern: the rib complex peaked at 2021 levels when pandemic supply chain issues cleared the market, then settled into a $2.00-$3.50/lb range. Backribs, St. Louis spareribs, and BBQ style spareribs all sit well below their 2021 highs heading into 2026. Chicken data is incomplete pre-2023, but the available record shows steady year-over-year price building from 2023 to a 2025 peak before the second-half collapse.
2.2 July 4th Pricing Patterns
Holiday date: July 4 each year
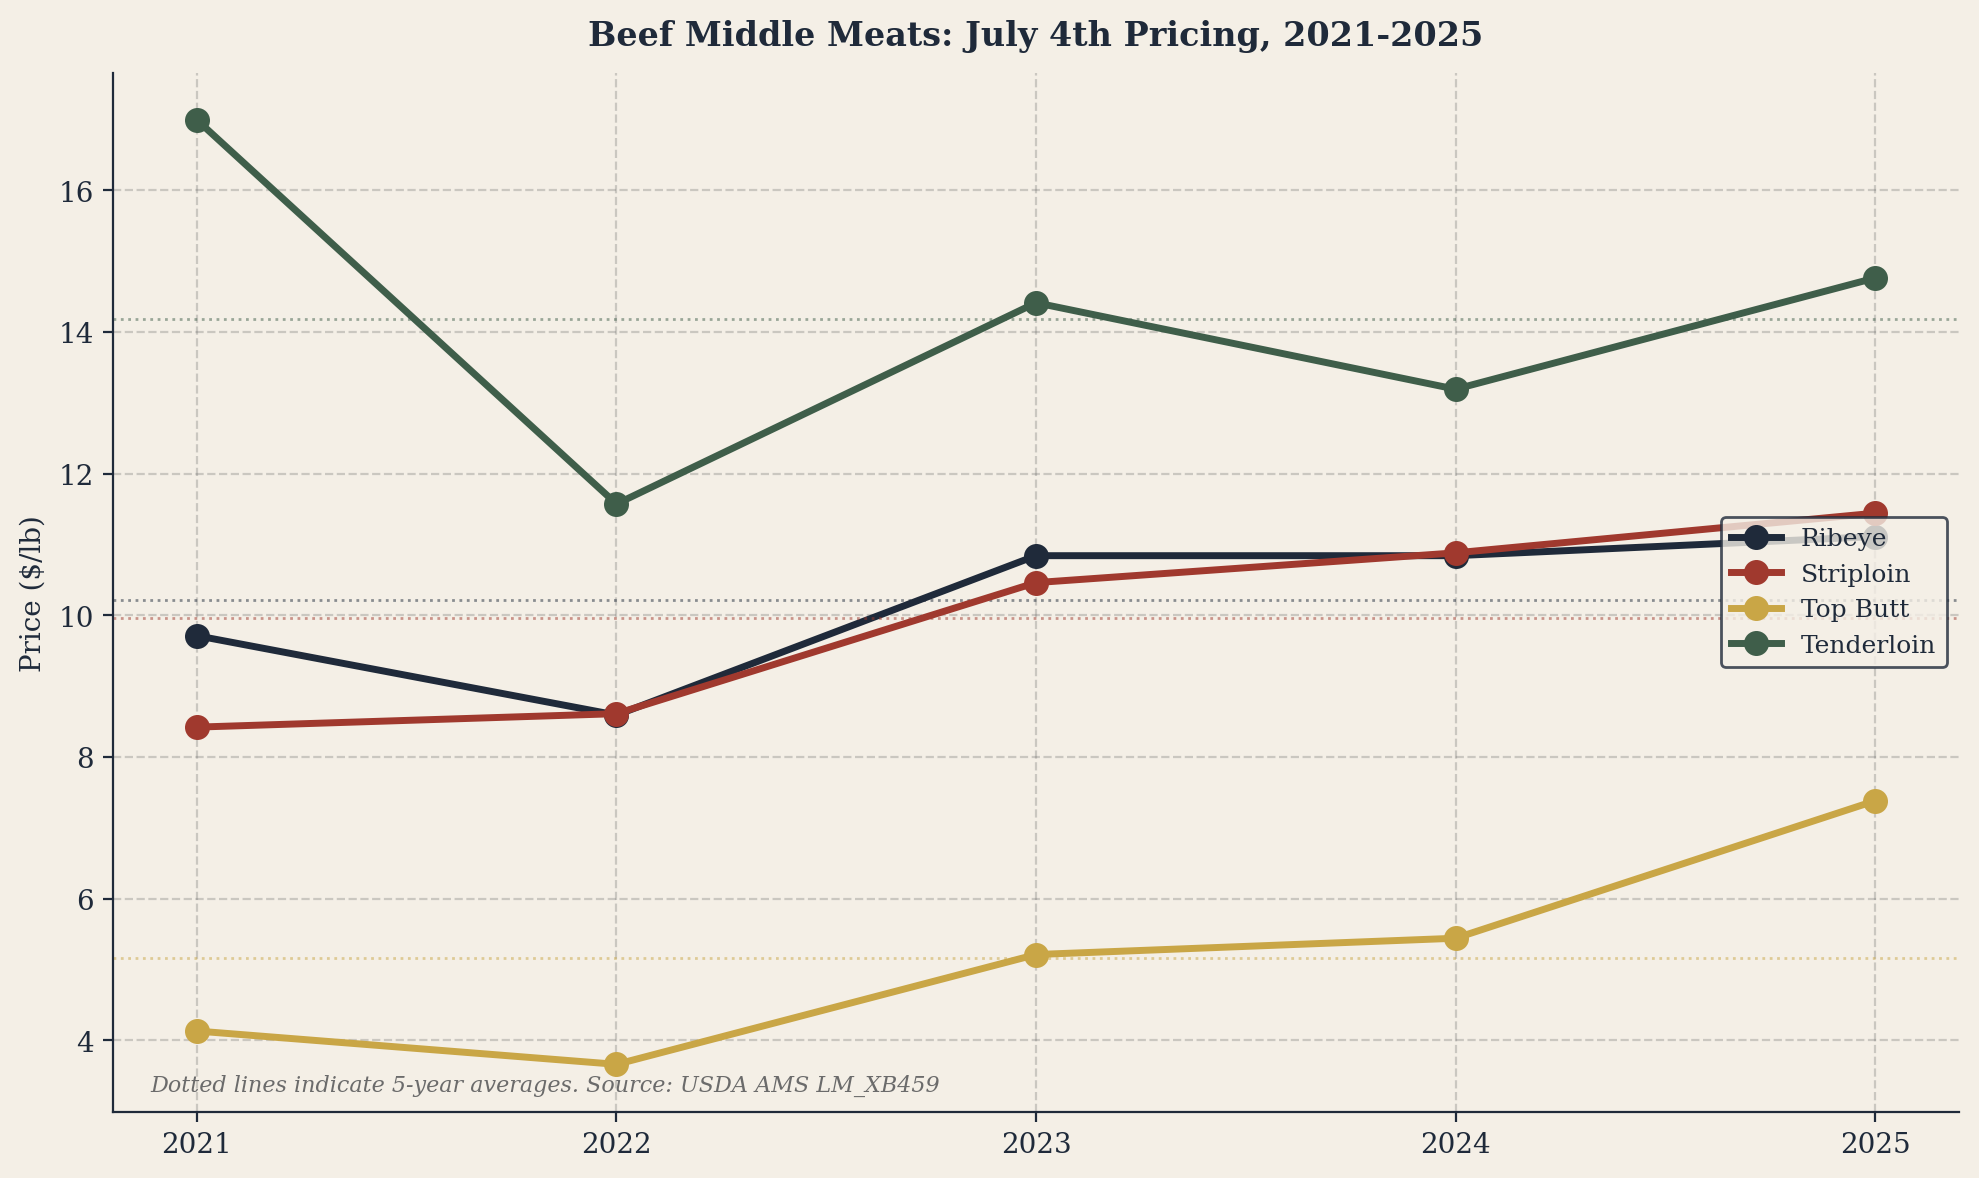
Figure 5. Beef Middle Meats: July 4th Pricing, 2021-2025.
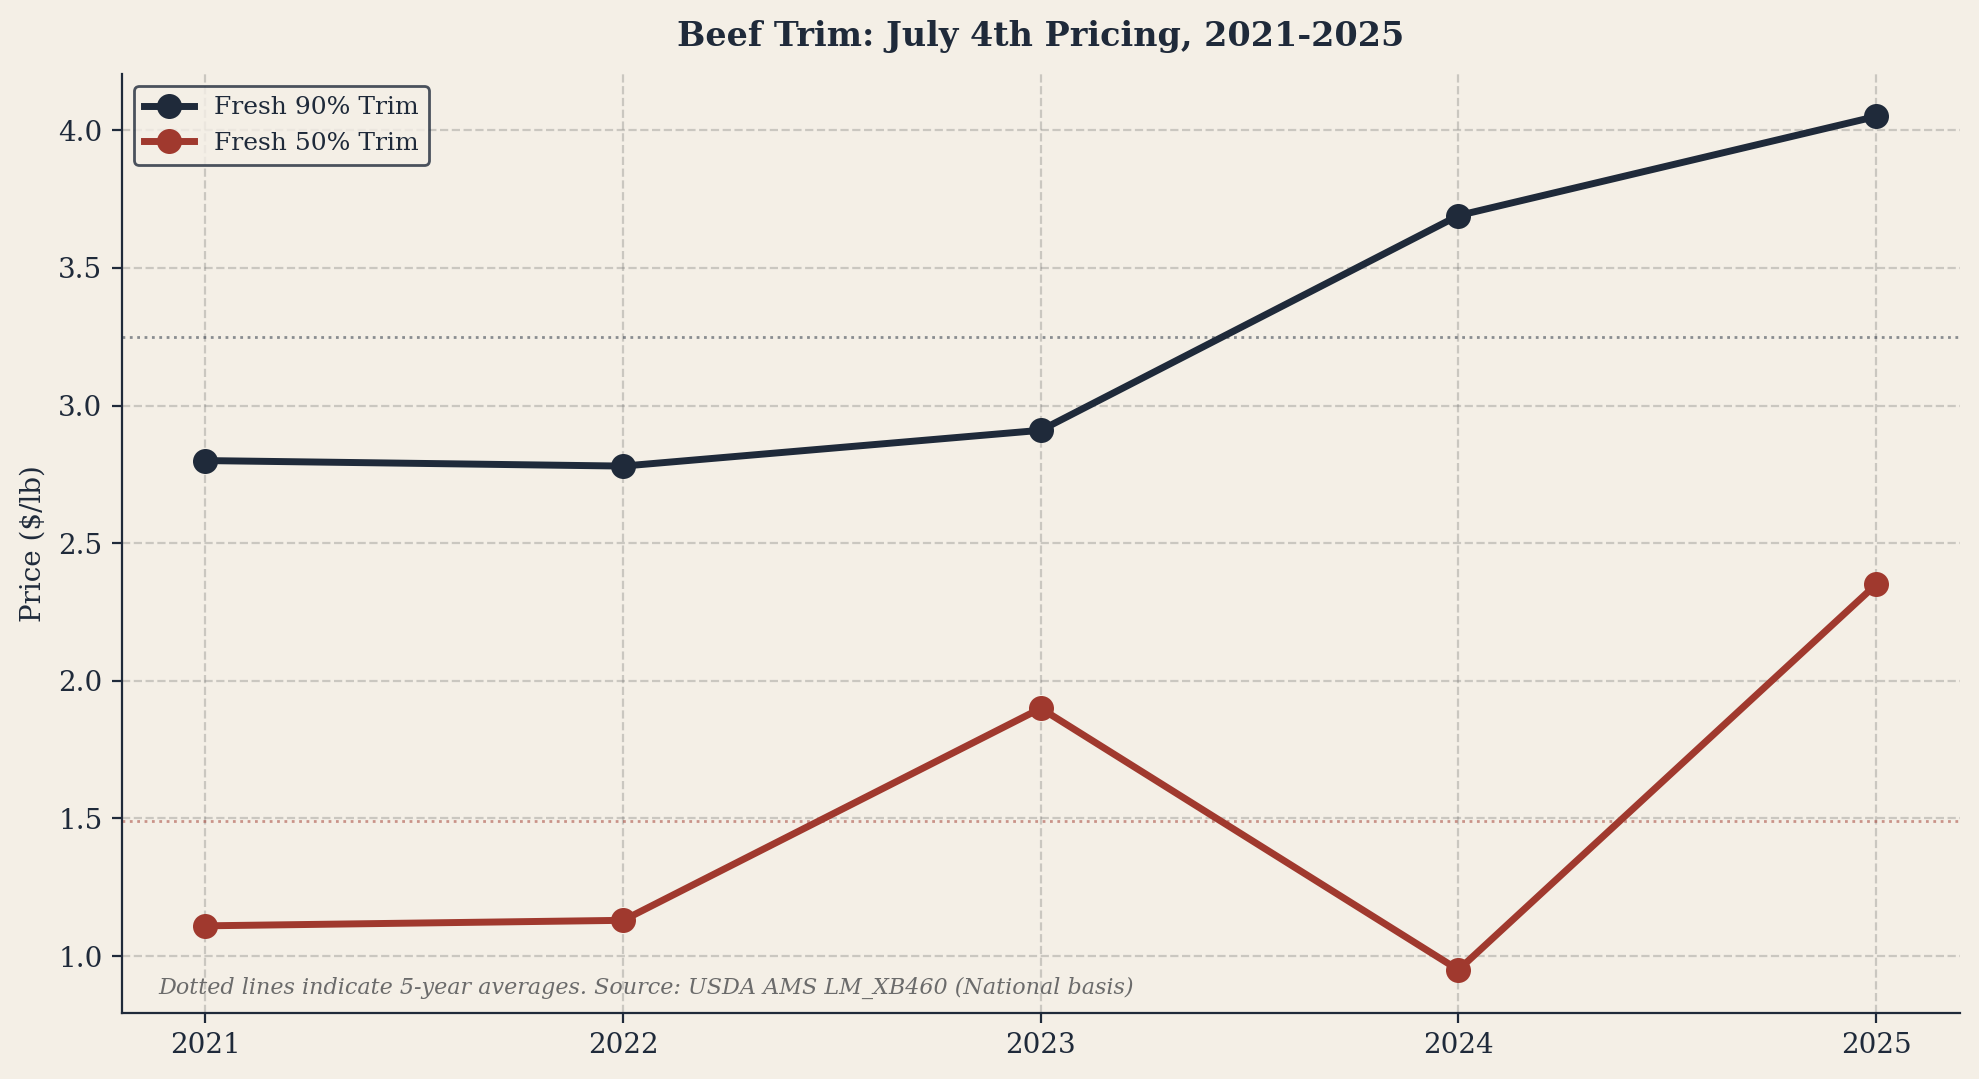
Figure 6. Beef Trim: July 4th Pricing, 2021-2025.

Figure 7. Pork Cuts: July 4th Pricing, 2021-2025.

Figure 8. Chicken Cuts: July 4th Pricing, 2023-2025.
Analysis. July 4 is a transitional window that reveals which cuts hold price post-Memorial Day pull and which retreat. Beef ribeye consistently softens from Memorial Day to July 4 in most years, reflecting demand normalization after the season opener. Striploin is the most consistent performer through July 4, often setting higher prints than Memorial Day as foodservice demand sustains. Tenderloin is the standout story through 2025: the cut held within a tight $13-$15/lb range across all five Julys. Pork tells the same softening story for ribs after Memorial Day: St. Louis at $4.45/lb in 2021 stayed elevated, but every subsequent year saw spareribs decline 30-50 cents from Memorial Day to July 4. Backribs are the exception, often setting their summer high in the July window. Fresh 90% trim has trended progressively higher each July since 2022, while fresh 50% has remained volatile, swinging between $0.95 and $2.35 across the same window.
2.3 Labor Day Pricing Patterns
Holiday dates: 9/6/21, 9/5/22, 9/4/23, 9/2/24, 9/1/25
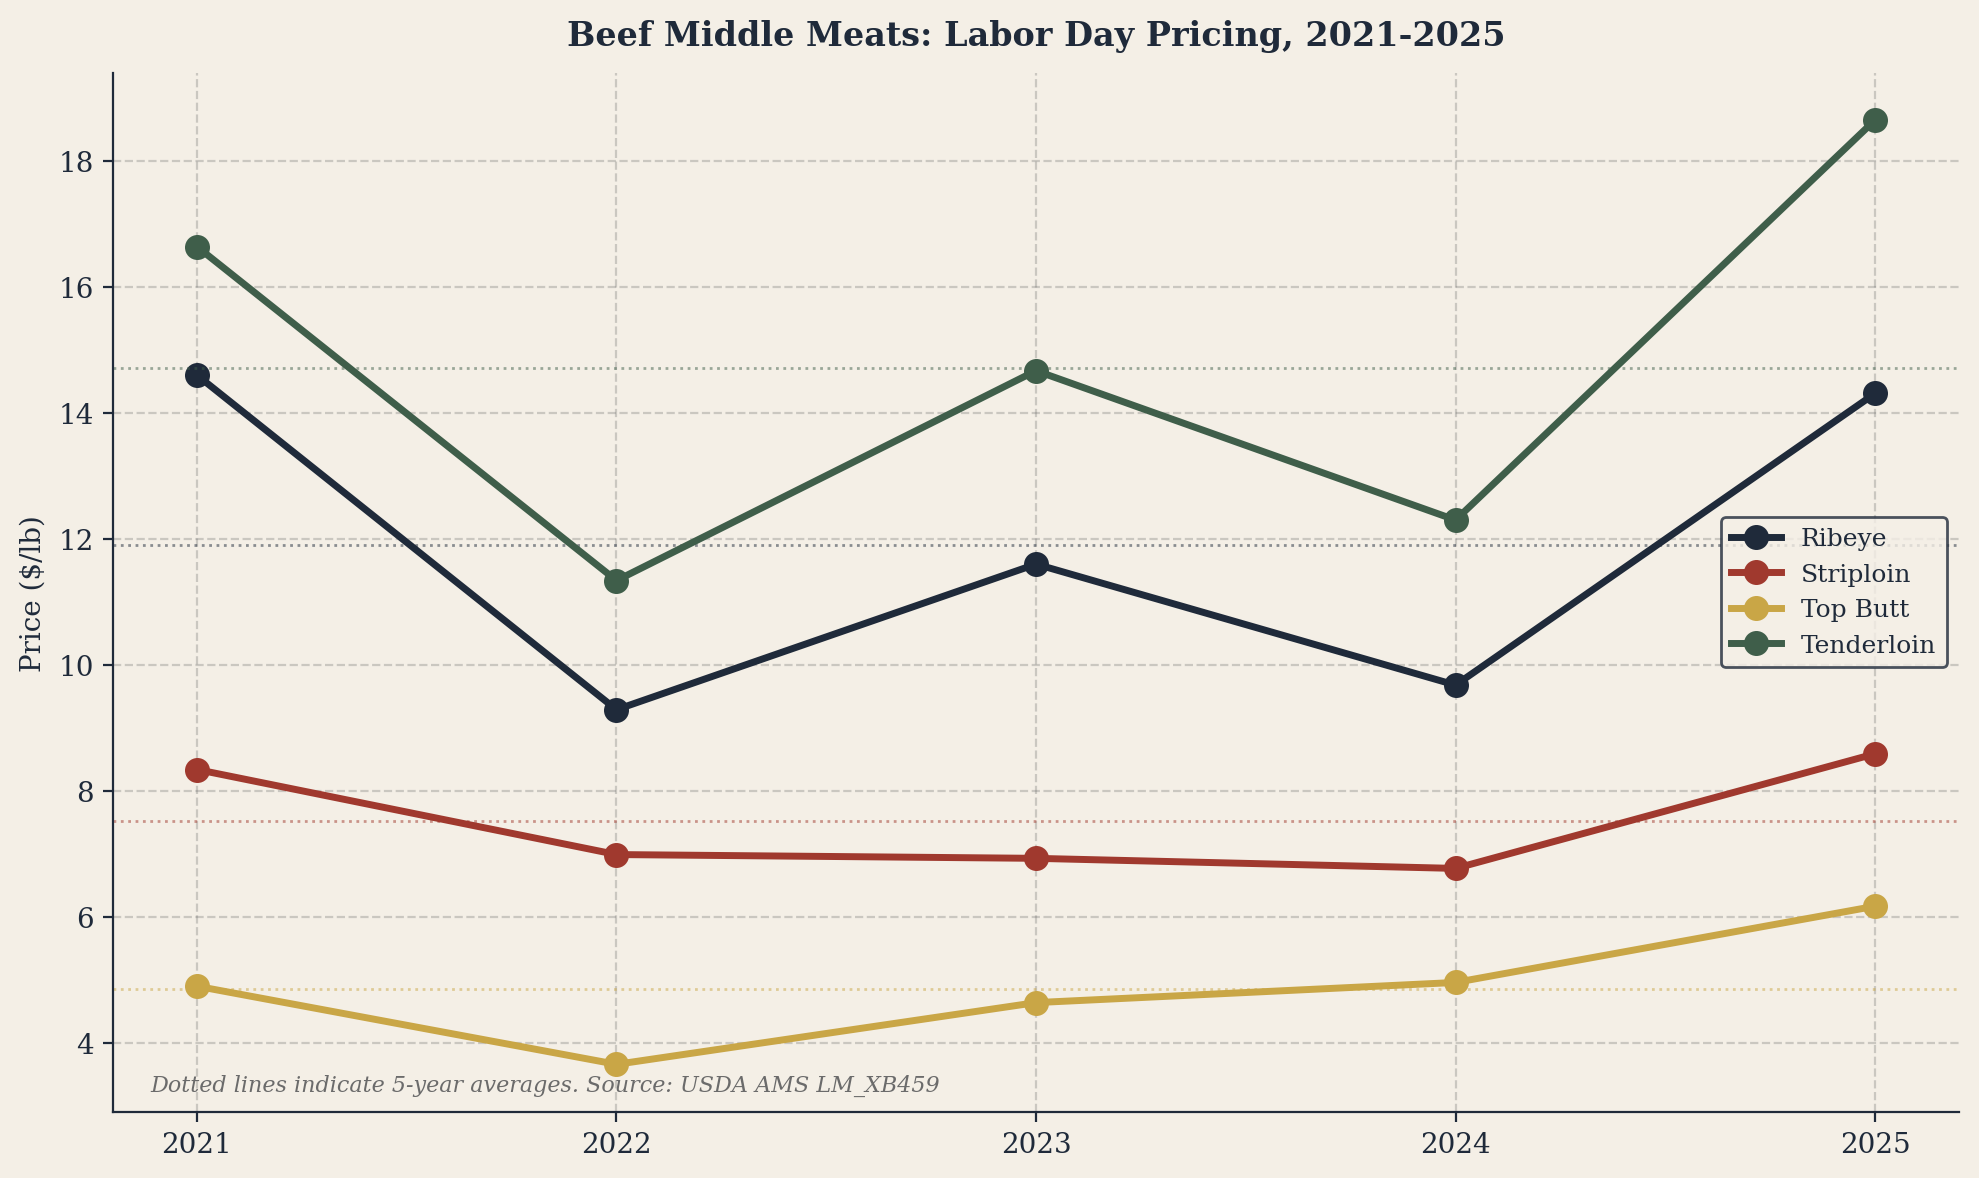
Figure 9. Beef Middle Meats: Labor Day Pricing, 2021-2025.
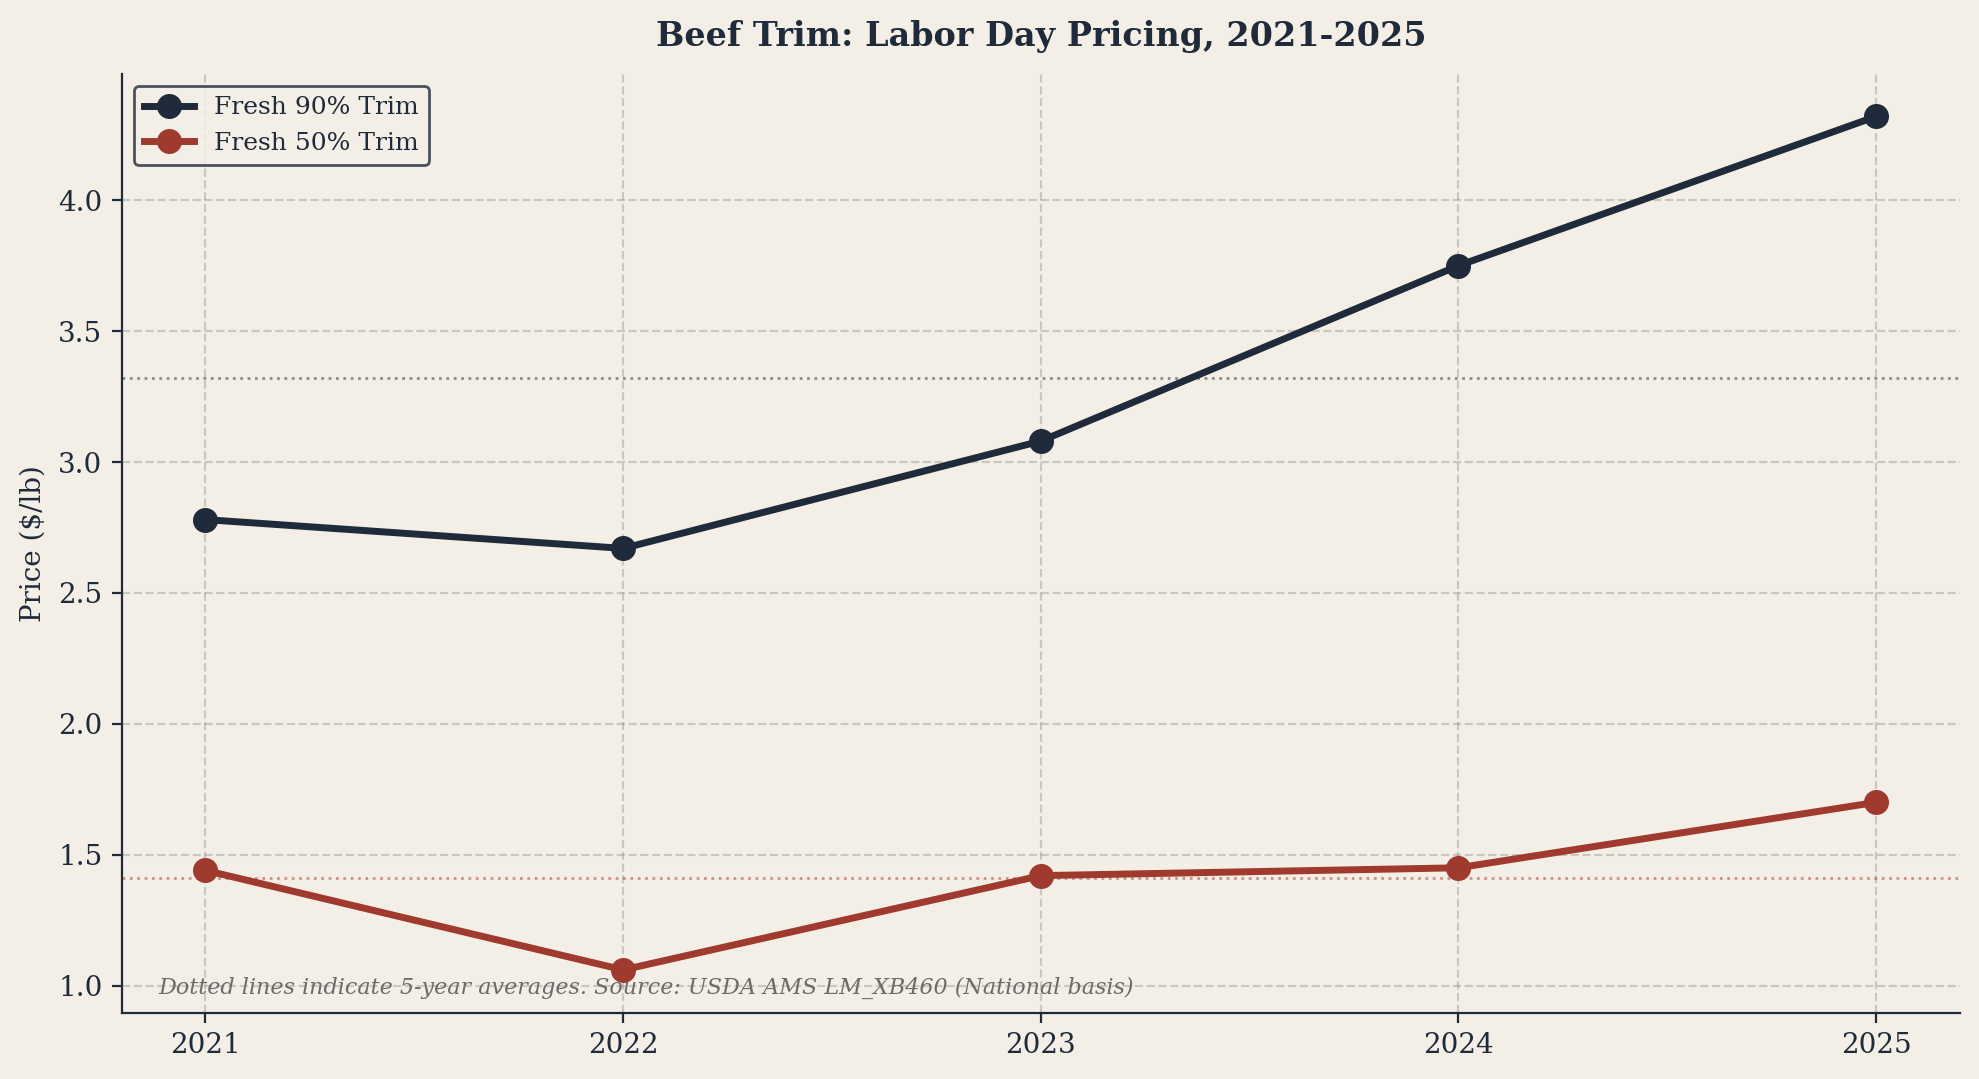
Figure 10. Beef Trim: Labor Day Pricing, 2021-2025.

Figure 11. Pork Cuts: Labor Day Pricing, 2021-2025.
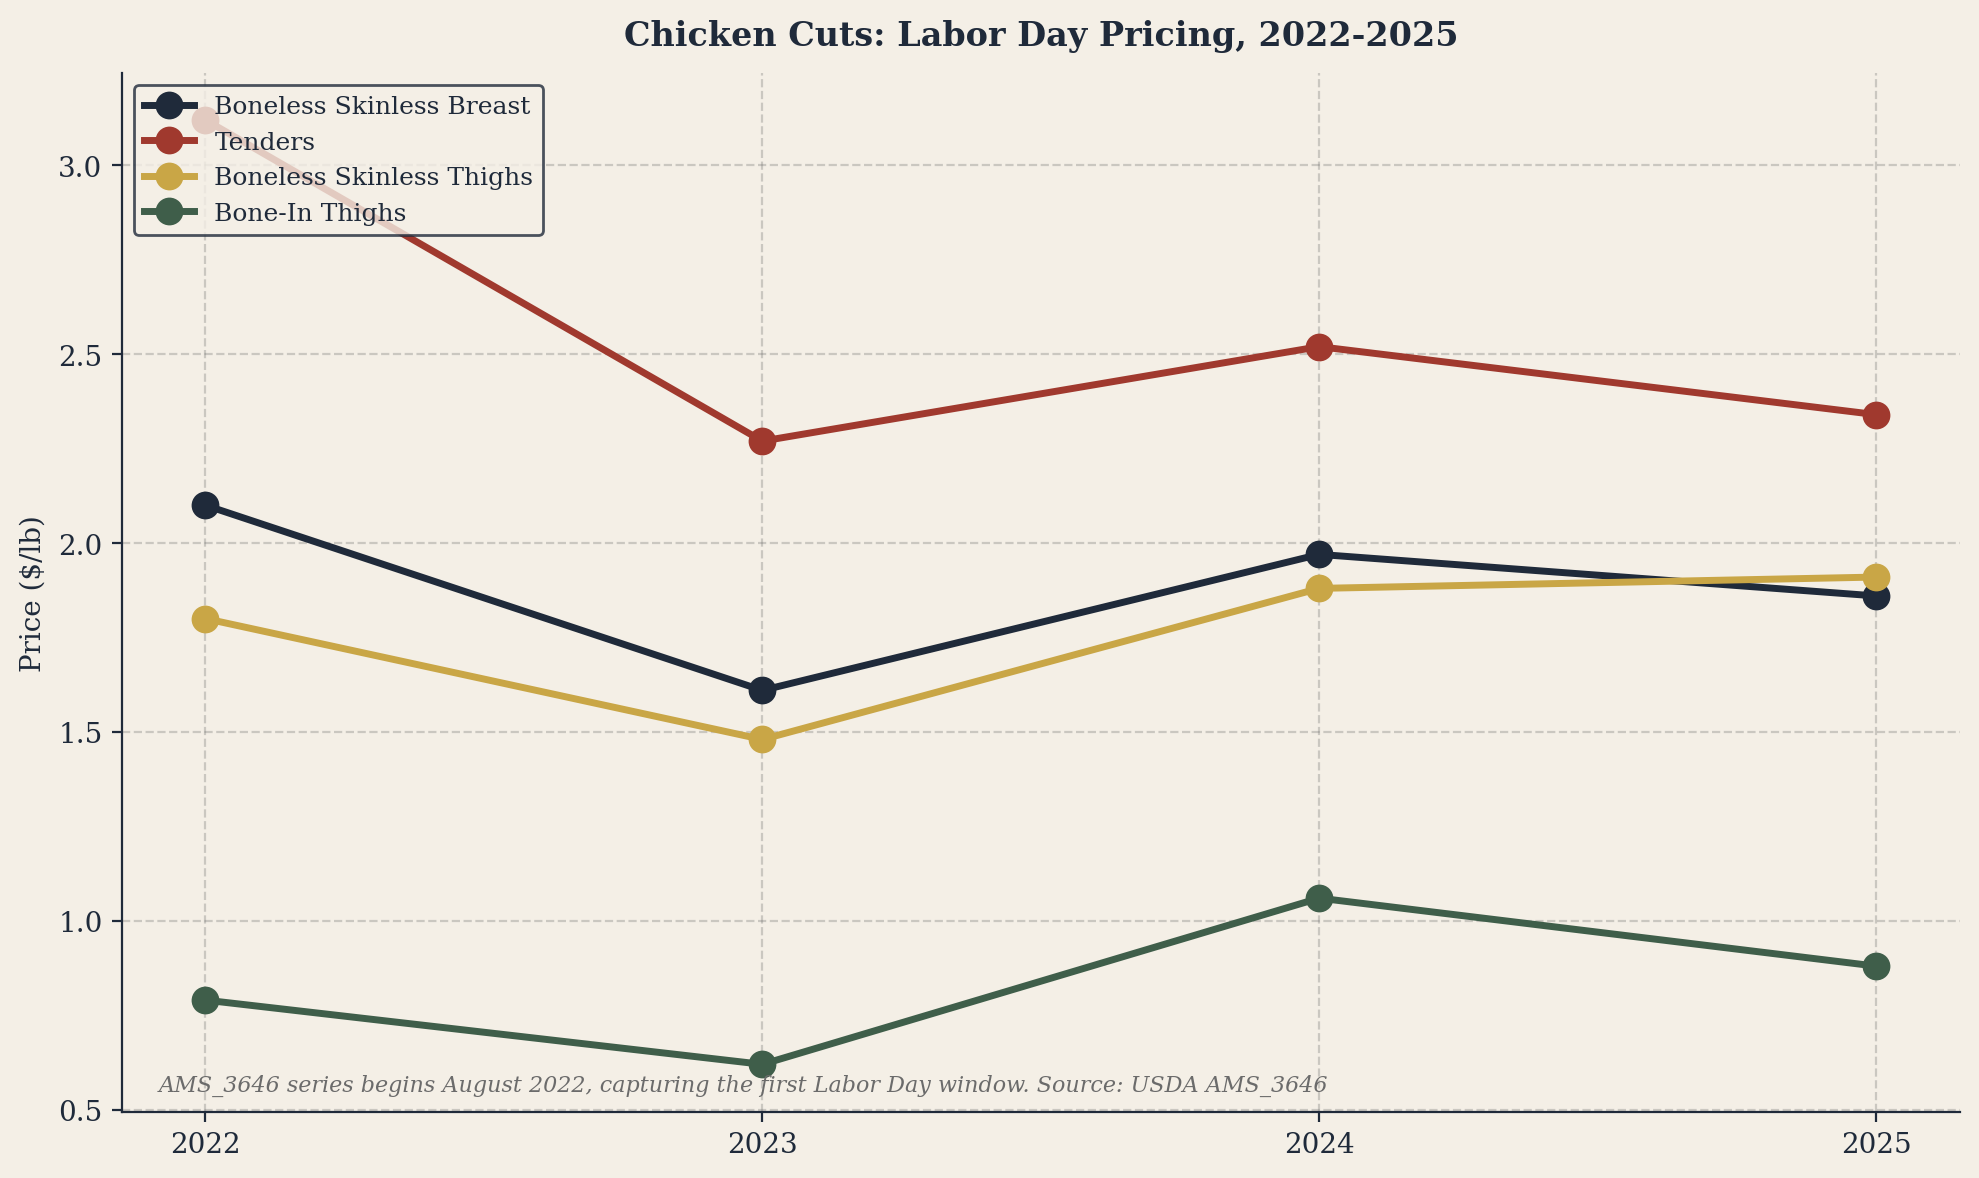
Figure 12. Chicken Cuts: Labor Day Pricing, 2022-2025.
Analysis. Labor Day produces the most surprising pattern in the dataset for beef. Choice ribeye and tenderloin set their seasonal highs in the Labor Day window in three of the past five years (2021, 2023, 2025), with 2025 setting an outright 5-year record at $14.31/lb for ribeye and $18.65/lb for tenderloin. Striploin and top butt go the opposite direction, consistently softening from Memorial Day to Labor Day as middle meat features normalize. Beef trim sets its seasonal high almost every year in the Labor Day window, with fresh 90% running progressively higher (from $2.78 in 2021 to $4.32 in 2025). Pork shows the textbook pattern: every cut softens from Memorial Day to Labor Day, with St. Louis spareribs falling 25-35% on average. The Labor Day pork window is the cyclical bottom for the rib complex.
5-YEAR PATTERN INSIGHT | The single most consistent pattern in five years of holiday data: ribeye and tenderloin peak at Labor Day, not Memorial Day. The 5-year average Choice ribeye Labor Day print at $11.90/lb sits $1.06 above the Memorial Day average ($10.84) and $1.68 above the July 4 average ($10.22). Tenderloin shows the same pattern: $14.72 Labor Day average versus $14.64 Memorial Day and $14.18 July 4. The opposite holds for pork: every sparerib variant prints lowest at Labor Day in nearly every year of the dataset. Bank on Labor Day strength in beef middle meats and Labor Day weakness in pork ribs. The third leg of the pattern, beef trim setting its annual high in the Labor Day window, is the cleanest sign in the dataset and signals when ground beef cost pressure is at its worst.
Section 3: Weather Outlook
Summer 2026 Climate Forecast (Continental US)
Weather is not something protein buyers typically model, but they should. Grilling demand is highly correlated with temperature and outdoor entertainment patterns. An unusually wet or cool summer suppresses grilling demand. A hot, dry summer amplifies it.
Summer 2026 carries specific meteorological signals worth understanding. This section presents the forecast for the Continental US straight from the source.
3.1 Summer 2026 Climate Forecast Overview
The NOAA Climate Prediction Center's June through August 2026 outlook signals a hot summer for most of the country. The strongest above-normal temperature signal sits over the interior West, centered on Utah, Colorado, Nevada, and surrounding states, where some areas show a 50-60% probability of above-normal temperatures. Above-normal warmth extends across the entire West Coast, the Southwest, much of the Plains, and the Northeast, with New England and the mid-Atlantic showing elevated odds of a hotter-than-average summer. The lone cool pool sits over the Upper Midwest and Great Lakes region.
The precipitation outlook is more mixed. The biggest above-normal precipitation signal is centered over the Desert Southwest and Four Corners. The mid-Atlantic and Southeast also lean above normal for summer rainfall. The Pacific Northwest leans below normal.
For grilling demand, this is a constructive setup. The key consumer markets in the West, South, and Northeast all skew warmer than average. The Upper Midwest cool pool is the only meaningful demand drag, and even there the variance is modest.
3.2 El Nino / La Nina Status
Summer 2026 is expected to develop under emerging El Nino conditions. The most recent weekly average (week centered on April 15, 2026) of the NINO3.4 index registered +0.5 degrees Celsius. The CPC issued the Final La Nina Advisory alongside an El Nino Watch in early April, marking the formal transition. The IRI and CPC ENSO plume forecast assigns a 70% probability of El Nino development in the April-June 2026 window, rising to a 62% probability of full El Nino conditions in June-August 2026, with high probabilities (88-94%) of El Nino persisting through the rest of 2026.
For protein buyers, the practical implication is twofold. The NOAA temperature outlook in Section 3.1 supports above-normal grilling demand across the largest consumer markets. The emerging El Nino signal cuts in a different direction. It reduces the probability of a La Nina-style drought-amplifying pattern across the central and southern Plains, which is the specific weather scenario that has historically driven corn crop stress and feed cost spikes. A hot summer for grilling demand combined with a non-drought corn belt is a constructive combination for protein margins. The risk to monitor is a regional anomaly that breaks from this base case, particularly any drought intensification in the western corn belt that the seasonal outlook does not currently signal.
WEATHER DATA NOTE | Industry consumer behavior research, including data from the Beef Checkoff and major QSR brands, indicates grilling occasion frequency rises 8-12% in above-normal-temperature summers and falls 6-9% in below-normal-temperature summers, with the strongest effect in the May-June window when grills first come out. The 2026 NOAA outlook supports an above-normal demand-side scenario across the largest consumer markets, with the Upper Midwest the only meaningful drag.
Section 4: Supply Fundamentals
From Feedlot to Fork: Cattle Inventory, Slaughter and Pricing
Protein pricing does not happen in a vacuum. The prices buyers pay this summer are the result of decisions made on feedlots 6 to 18 months ago. Understanding the supply chain pipeline gives buyers the structural context behind the numbers they see at the rail.
4.1 The Cattle Supply Pipeline
The April 1, 2026 USDA Cattle on Feed report showed 11.6 million head on feed, down 1% from April 1, 2025. This is the seventeenth consecutive month of year-over-year inventory declines. There were 7.26 million steers and steer calves on feed (down slightly from 2025) and 4.32 million heifers on feed (down 1.4%). The lower heifer count is structurally important. Heifers retained on feed are heifers not retained for breeding, and the reduced rate of heifer placement in 2026 is the clearest available signal that the herd rebuild has not yet started in earnest.
March placements and marketings both came in at the second-lowest levels for the month since 1996. For grilling season 2026, this translates to fewer cattle moving through the slaughter window from June through September, with the tightest availability concentrated in the July-September period as packers work through the placements made last fall. The total US cattle inventory now sits at 86.2 million head, the lowest level since 1951. Meaningful herd rebuilding will not occur until 2027 at the earliest, with material consumer-level supply relief unlikely before 2029-2030.
4.2 Slaughter Pace and Processing Capacity
Year-to-date federally inspected cattle slaughter through April 24, 2026 totals 8.61 million head, down 9.9% from 9.55 million head in the same period of 2025. The most recent week's slaughter, ending April 24, came in at 533,000 head, 53,000 head below the same week of 2025. Packers have responded by feeding cattle to heavier weights, but the carcass weight gain is not enough to offset the headcount shortfall on a pounds-of-beef basis.
For pork, year-to-date hog slaughter through April 24 totals 40.9 million head, down only 0.4% from 2025. The week ending April 18 saw 807,000 head slaughtered in Iowa-Southern Minnesota alone, up from 749,000 head a year ago. USDA's full-year forecast for 2026 pork production is 28.3 billion pounds, up 2.5% from 2025.
For chicken, the latest weekly poultry slaughter readings show 167.7 million young chickens with a ready-to-cook weight of 838.7 million pounds. Broiler placements during the week ending April 18 totaled 198 million chicks, up 4% year-over-year. The constraint sits upstream in the breeder flock, not at the processing plant.
4.3 Cold Storage: Reading the Inventory Signal
The USDA Cold Storage report released April 23, 2026 (data as of March 31, 2026) showed total red meat at 838.4 million pounds, down 2% from a year ago. Beef in cold storage stood at 410.5 million pounds, down 3% year-over-year and down 5% from the prior month. Pork inventory was nearly unchanged at 411.3 million pounds, with pork bellies up 5% from the prior month but down 8% year-over-year.
Total poultry stocks sat at 1.025 billion pounds, down 5% year-over-year. Chicken cold storage at 746.8 million pounds was down 3% from 2025, even as monthly broiler production rose 10% year-over-year. The tightening of chicken inventory despite rising production is a direct signal of demand strength rebuilding off the second-half 2025 collapse.

Figure 13. The Cattle Supply Pipeline: Feedlot to Pricing, Spring 2026.
4.4 Pork and Chicken Supply Signals
The pork hog supply pipeline is comfortably positioned for grilling season but tightening for the back half of the year. The March 1, 2026 hog inventory of 74.3 million head is up slightly from 2025, but the breeding herd at 5.89 million head is the smallest March 1 reading since 2014. Pigs saved per litter rose 2.1% to 11.90, which has compensated for the breeding herd contraction so far. Sow farrowing intentions for March-May 2026 total 2.86 million head, with 2.90 million for June-August.
The chicken broiler supply picture is more nuanced than the headline placements suggest. Broiler placements at 198 million chicks for the week ending April 18 are up 4% year-over-year, but pullet placements (the birds intended to produce future chicks) are running 4% below year-ago. Hatchability has not fully recovered from the cumulative HPAI impact on breeder flocks dating back to 2022, though a portion of the hatchability decline reflects a deliberate breed improvement tradeoff. The total US poultry losses since the start of the HPAI cycle have crossed 200 million birds (USDA APHIS, cumulative through April 2026).
Section 5: The Procurement Playbook
What Buyers Should Do Before Memorial Day
Data is only useful if it informs action. This section translates everything in the report into a concrete set of procurement considerations for protein buyers heading into the 2026 grilling season.
5.1 Beef: Key Considerations
Lock middle meat coverage for the Labor Day window now. The 5-year holiday data is unambiguous: Choice ribeye and tenderloin set seasonal highs in the Labor Day window in three of the past five years. The 5-year average Choice ribeye Labor Day print of $11.90/lb sits above both Memorial Day ($10.84) and July 4 ($10.22). With current Choice ribeye at $11.26/lb tracking the 5-year Labor Day trend already in late April, buyers who push coverage decisions past mid-summer face a likely $13-$14/lb spot environment given the structural cattle shortage.
Treat the trim cost shock as the formulation issue, not the menu issue. Fresh 90% trim is up 20.1% year-over-year and Fresh 50% is up 71.9%. The 5-year Labor Day average for fresh 90% is $3.32/lb; current is $4.50. Operators with significant ground beef volume should model trim cost at $4.50-$5.00/lb floor for the second half of 2026 and adjust formulation, blend ratios, or menu pricing accordingly.
Watch the slaughter pace weekly. A 9.9% year-to-date slaughter shortfall against any further demand uptick will move wholesale prices higher. Track the USDA AMS Daily Livestock Slaughter report week-over-week and adjust forward booking cadence accordingly.
Top butt is the rotational opportunity. At $6.18/lb current and a 5-year Memorial Day average of $5.08, top butt has the most room for retailer feature substitution into ribeye-like menu positions when the cost spread to ribeye widens (current ribeye-to-top butt spread: $5.08/lb).
5.2 Pork: Key Considerations
Lock spareribs coverage before May 10. All three sparerib variants are firming hard heading into Memorial Day. St. Louis VAC at $2.45/lb is up 9.1% year-over-year, BBQ style at $2.21/lb is up 11.9%, and trimmed light at $1.85/lb is up 13.6%. The 5-year data shows St. Louis hits its seasonal high in the Memorial Day window roughly 60% of the time. Buyers who wait for May feature placements will pay the premium.
Use loin and tenderloin as the value anchors. Boneless center-cut loin at $1.34/lb is essentially flat year-over-year and sits below the 5-year Memorial Day average. Pork tenderloin at $1.83/lb is up only 5.8%. Both are ideal for retailer feature programs and operator menu items where margin matters more than premium positioning.
Plan Q4 supply tightening into the budget. The breeding herd contraction (-1.5% year-over-year, smallest March 1 since 2014) signals tighter pork supply for the second half of 2026. The grilling season comfort will not extend into Q4. Forward contracting for October-December should reflect a 5-10% tightening assumption.
Backribs are the demand-driven outlier. At $2.91/lb and flat year-over-year, backribs offer a stable cost basis but historically rally hard in the July window (5-year July average of $3.18 sits above Memorial Day average of $3.12). Operators who feature backribs for July 4 should secure coverage early.
5.3 Chicken: Key Considerations
Chicken is the substitution beneficiary, but treat the YoY drop as a temporary low. Boneless skinless breast at $1.68/lb is down 39% year-over-year off the late-2025 collapse. The market has been rebuilding since January 2026 (low of $1.19, current $1.68) and the trajectory points higher into Memorial Day on broiler breeder constraints and demand pull from beef substitution. Buyers should treat current levels as the buying opportunity.
Lock tender coverage first. Tenders at $1.83/lb are down 18.6% year-over-year but have firmed steadily through Q1 2026. With foodservice and QSR demand strong, the 5-year Labor Day average of $2.56 indicates the seasonal high. Coverage for the full Memorial Day to Labor Day window should be locked before mid-May.
Watch HPAI weekly. A summer HPAI spread into broiler breeder operations is the single biggest risk to chicken supply for grilling season. Track USDA APHIS reports and broiler hatchery placements weekly. Any meaningful disruption pushes the rebuilding price trend higher faster.
Bone-in thighs at $0.75/lb are the lowest absolute cost protein in the report. With a 5-year Labor Day average of $0.84, current pricing sits 11% below trend. Operators with menu flexibility should position bone-in thigh products aggressively for the grilling window.
5.4 Cross-Category Strategy
The 2026 grilling season presents protein buyers with the clearest decision tree in five years. The data points to a single conclusion: the cost of indecision is now higher than the cost of commitment. Choice ribeye at $11.26/lb sits atop a structural cattle shortage that will not resolve materially before 2029. Pork ribs are firming on schedule into Memorial Day with no relief signal in the supply pipeline. Chicken is rebuilding from a generational price floor and the trajectory is up, not flat.
The procurement decisions worth making this week are concrete: lock pork rib coverage before May 10, secure beef middle meat coverage for the Labor Day window now, and treat current chicken pricing as the buying opportunity it is rather than the discount it appears to be. Buyers who model trim cost at a $4.50 to $5.00/lb floor for the second half of 2026 will protect their formulation economics. Buyers who do not will absorb a margin contraction that the data has been signaling since the start of the year.
For retailers, the strategy inverts. Beef remains the traffic-driver for the grilling occasion even at record pricing, with the highest absolute dollar margin per unit of any category in the report. Pork and chicken position as the value alternatives, with feature cadence designed to capture households trading down. The opportunity is not to choose between the proteins. It is to use the spread between them with intention.
BOTTOM LINE | The five-year holiday data, the structural supply position, and the current pricing trajectory all point to the same conclusion. Buyers who commit forward coverage in the next ten days will operate from a stronger position through Labor Day than buyers who wait for clearer signals. The signals are already clear.
Appendix: Methodology and Data Sources
Data Sources
All pricing data sourced directly from USDA Agricultural Marketing Service (AMS) reports via API CSV pulls. Specific reports referenced: LM_XB459 (National Weekly Boxed Beef Cutout) for ribeye, striploin, top butt, and tenderloin; LM_XB460 (National/Regional Weekly Boneless Processing Beef and Beef Trimmings, National basis) for fresh 90% and fresh 50% lean trim; LM_PK610 (National Weekly Pork FOB Plant) for boneless center-cut loin, backribs, three sparerib variants, and pork tenderloin; AMS_3646 (Weekly National Chicken Report) for boneless skinless breast, tenders, boneless skinless thighs, and bone-in thighs.
Weather and climate data sourced from NOAA Climate Prediction Center (CPC) seasonal outlooks for the Continental US. ENSO forecasts from IRI/CPC.
Cattle on Feed, slaughter, and cold storage data from USDA National Agricultural Statistics Service (NASS) and USDA AMS.
Coverage Notes
The AMS_3646 chicken series begins in August 2022. Holiday window pricing for chicken is therefore not available for Memorial Day 2021, July 4 2021, Labor Day 2021, Memorial Day 2022, or July 4 2022. The 5-year average for chicken is calculated on available years only and noted as such.
Analytical Framework
HighLine's analytical approach is grounded in three principles. First, raw market data is only as useful as the procurement decisions it informs, so every data point in this report ties to a specific buyer action. Second, supply fundamentals trump short-term price signals, so we anchor every conclusion in the structural drivers that determine pricing 6-18 months out. Third, independence is non-negotiable. Our positions are not shaped by supplier relationships, packer sponsorships, or commission structures.
Limitations and Caveats
Commodity markets are inherently unpredictable. This report reflects the best available data and analysis at time of publication. HighLine does not guarantee specific price outcomes. Market conditions, trade policy, weather events, animal disease outbreaks, and other factors can materially alter the outlook described in this report. This report is intended for the exclusive use of HighLine subscribers. It is not intended as investment advice.
INDEPENDENT ADVISORY NOTE | HighLine Consulting Group Inc does not represent any supplier, packer, or distributor. Every analysis in this report reflects independent market intelligence developed from publicly available data and 30+ years of industry experience. Our only obligation is to the accuracy of the information and the success of the buyers who rely on it.
About HighLine Consulting Group Inc
HighLine Consulting Group Inc is an independent protein industry advisory firm. We serve procurement professionals, food companies, and operators who need clear, independent intelligence on the beef, pork, and chicken markets. Our work is grounded in 30+ years of hands-on industry experience. Not brokerage relationships. Not supplier sponsorships. Just honest analysis.